[ Introduction |
Archive page |
Spectrograph page |
Data
products page |
SOPHIE
server ]
Highlights of the SOPHIE Archive
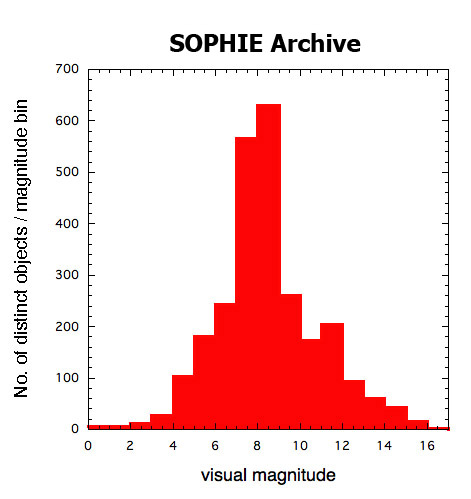 Magnitudes Magnitudes
The plot at the left shows the number of distinct objects in the Archive
per visual magnitude bin. Note the large peak between magnitudes 7 and 9 and
also the significant number of fainter objects, particularly between 11
and 12.
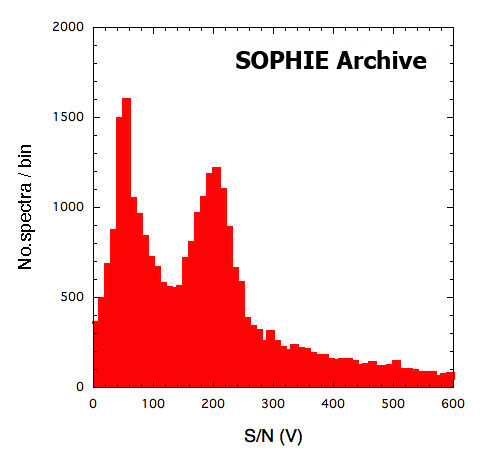 Signal-to-Noise ratio for all spectra
SOPHIE spectra are characterized by the
signal-to-noise ratio in order 26 (corresponding to the center of the V
band).
The plot here illustrates the distibution of all S/N values in the Archive.
Note the strong peaks near S/N = 50 and 200. The latter is due
to several seismology runs where many consecutive spectra with high S/N
were taken every night. Beyond 600,
the unplotted part of the histogram declines smoothly up to S/N values
reaching 1000.
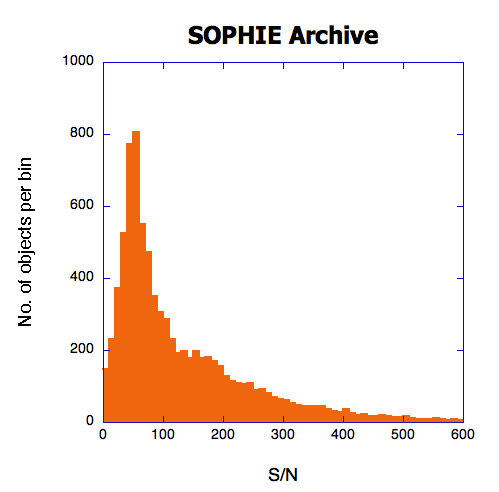 Signal-to-Noise ratio for distinct objects Signal-to-Noise ratio for distinct objects
This figure shows the number of distinct objects with spectra having a given
S/N ratio. The peak at 50 is still present but the peak at 200,
due to a large number of high S/N spectra for just a
few objects, is no longer seen.
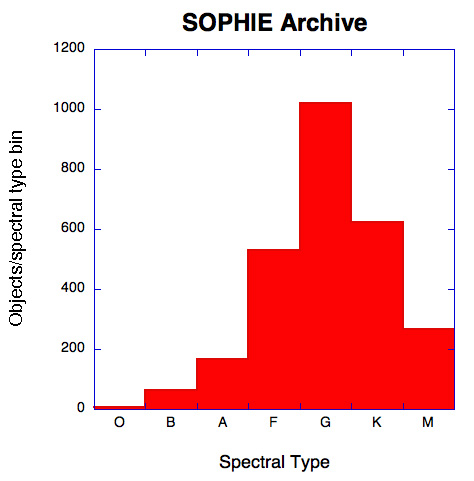 Spectral types Spectral types
The distribution of spectral types in the Archive is
illustrated here, where it is seen that most objects that have been or
are being observed are of solar type, with a significant fraction of F, K
and M stars.
updated on: 10.10.2008
|
